Bus Arrival Prediction Solution

Bus Arrival Prediction Solution by Ampron
Visualizing of accurate bus arrival information is vital to passengers for reducing their anxieties and waiting times at the bus stop.

What and Why?

Visualizing of accurate bus arrival information is vital to passengers for reducing their anxieties and waiting times at the bus stop. 

Additionally, based on data collected, traffic managers can adjust departure schedules and monitor bus availability needs to ensure service quality. 

By using self-driving buses, the integrations and possibilities can be further developed in the future within the framework of Smart City. 

How does it work?

Data is gathered through GPS trackers and software generates the output information using the algorithmic calculations and deep learning methodology. 

Using a real-world trajectory dataset generated by the on-site buses, a bus arrival time prediction system is built and it is constantly self-improving by making better predictions. 

Main Features

BUS LOCATION VISUALISATION 

Visualises bus location on the map that is shown on the bus shelter signage. 

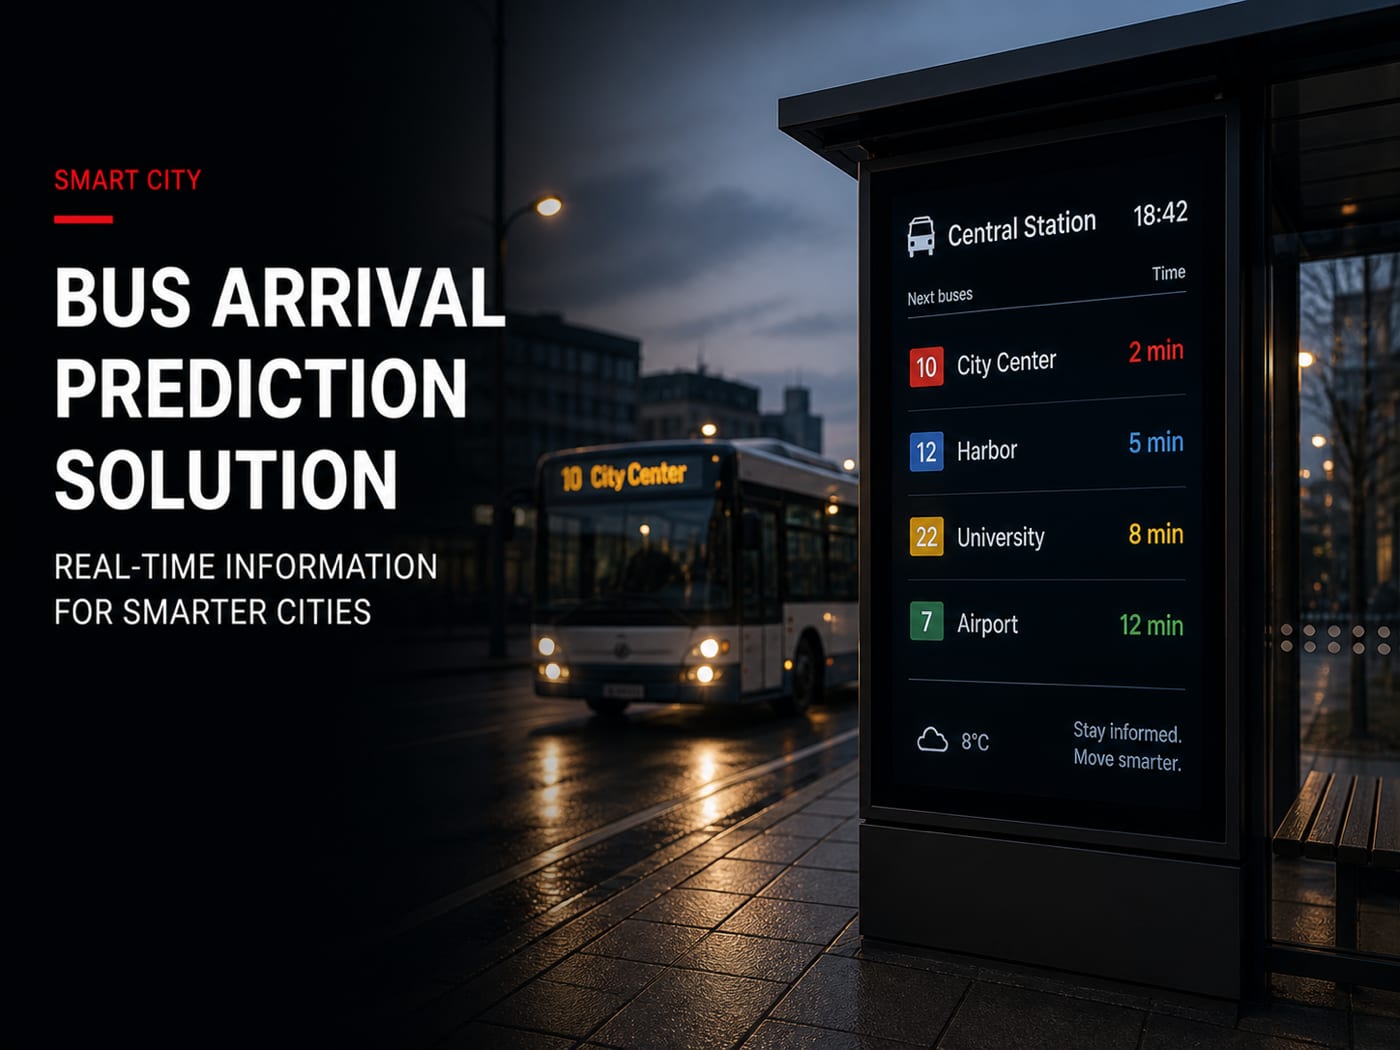
BUS ARRIVAL PREDICTION 

Based on algorithms and information from the sensors, the software calculates the bus arrival time. 

INFO ON DISPLAYS 

Information output from predictions will be visualized on the screens at the shelter for passengers. 

Bus Location Visualisation

Info on LED Display

Info on LCD Signage

Download Brochure here

Liked the article? Share it!

Waybiller Use Case: Real-Time Traffic Guidance at the Port of Kunda

Ampron displays power Waybiller’s smart logistics system at the Port of Kunda. Integrated with license plate recognition and weighing systems, our outdoor LED display delivers real-time instructions to truck drivers — reducing delays and eliminating confusion. A seamless solution for faster, smarter port logistics.

Read More »

How to Make Your Kanban Board Work Better with WIP Limits and Smarter Idea Management

One of the most common issues with digital Kanban boards is what happens to the first column — the “Ideas”, “Inbox”, or “Backlog”. Over time, it tends to balloon. Ideas accumulate faster than they’re acted on, and suddenly your once-organized board starts to look more like a cluttered notepad.

If you want to regain clarity, stay focused, and reduce mental friction, here’s a simple process we used to restructure our board — and it worked wonders.

Read More »