
Know every screen is showing the right thing, from inside your own network.
Ampron Monitoring is being packaged to run on your own server, next to your own system. It watches every Ampron display in your fleet, checks the content as well as the connection, and keeps the outage record your service agreement is measured on. Planning a fleet or a tender? Talk to us now.
Content, not just connection.
A screen that's on but blank, or still showing an old timetable, is a fault. Ampron Monitoring checks the live data feed behind every screen every five minutes and shows you what the screen is displaying right now.
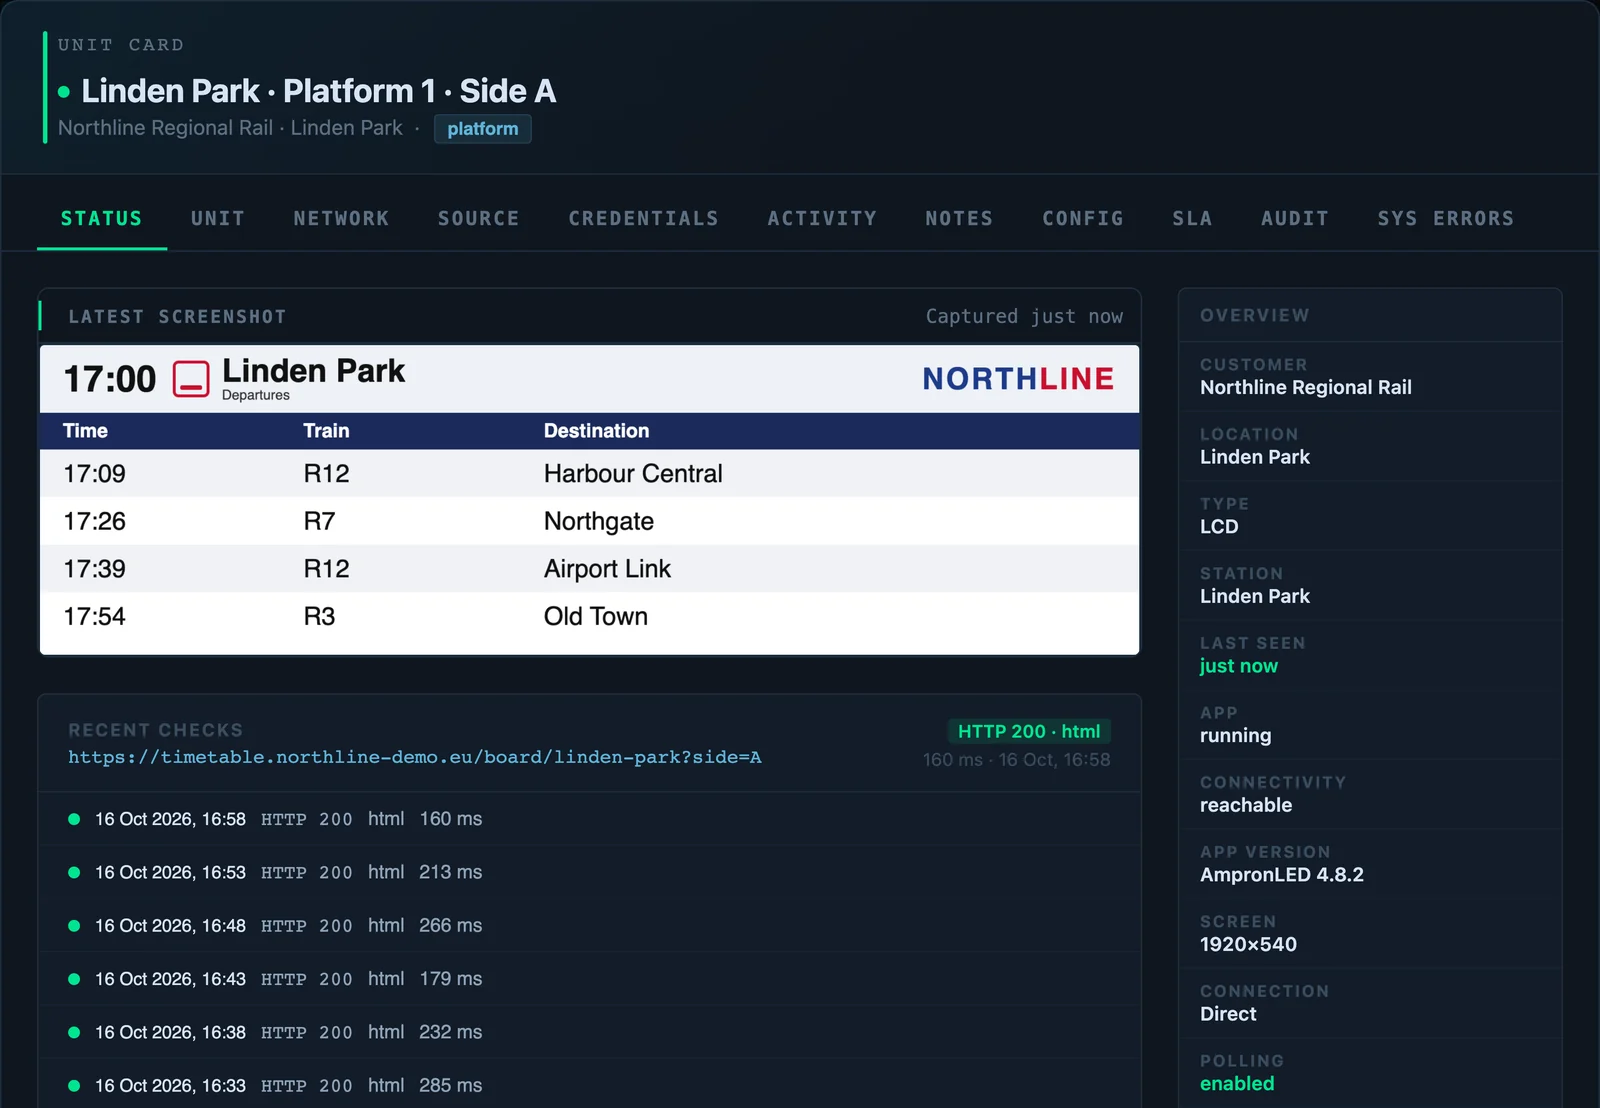 Demo data
An outage record you can show an auditor.
Every outage is logged as a real time interval, per screen, with overlaps merged. The availability figure for any period comes from that record, not an estimate.
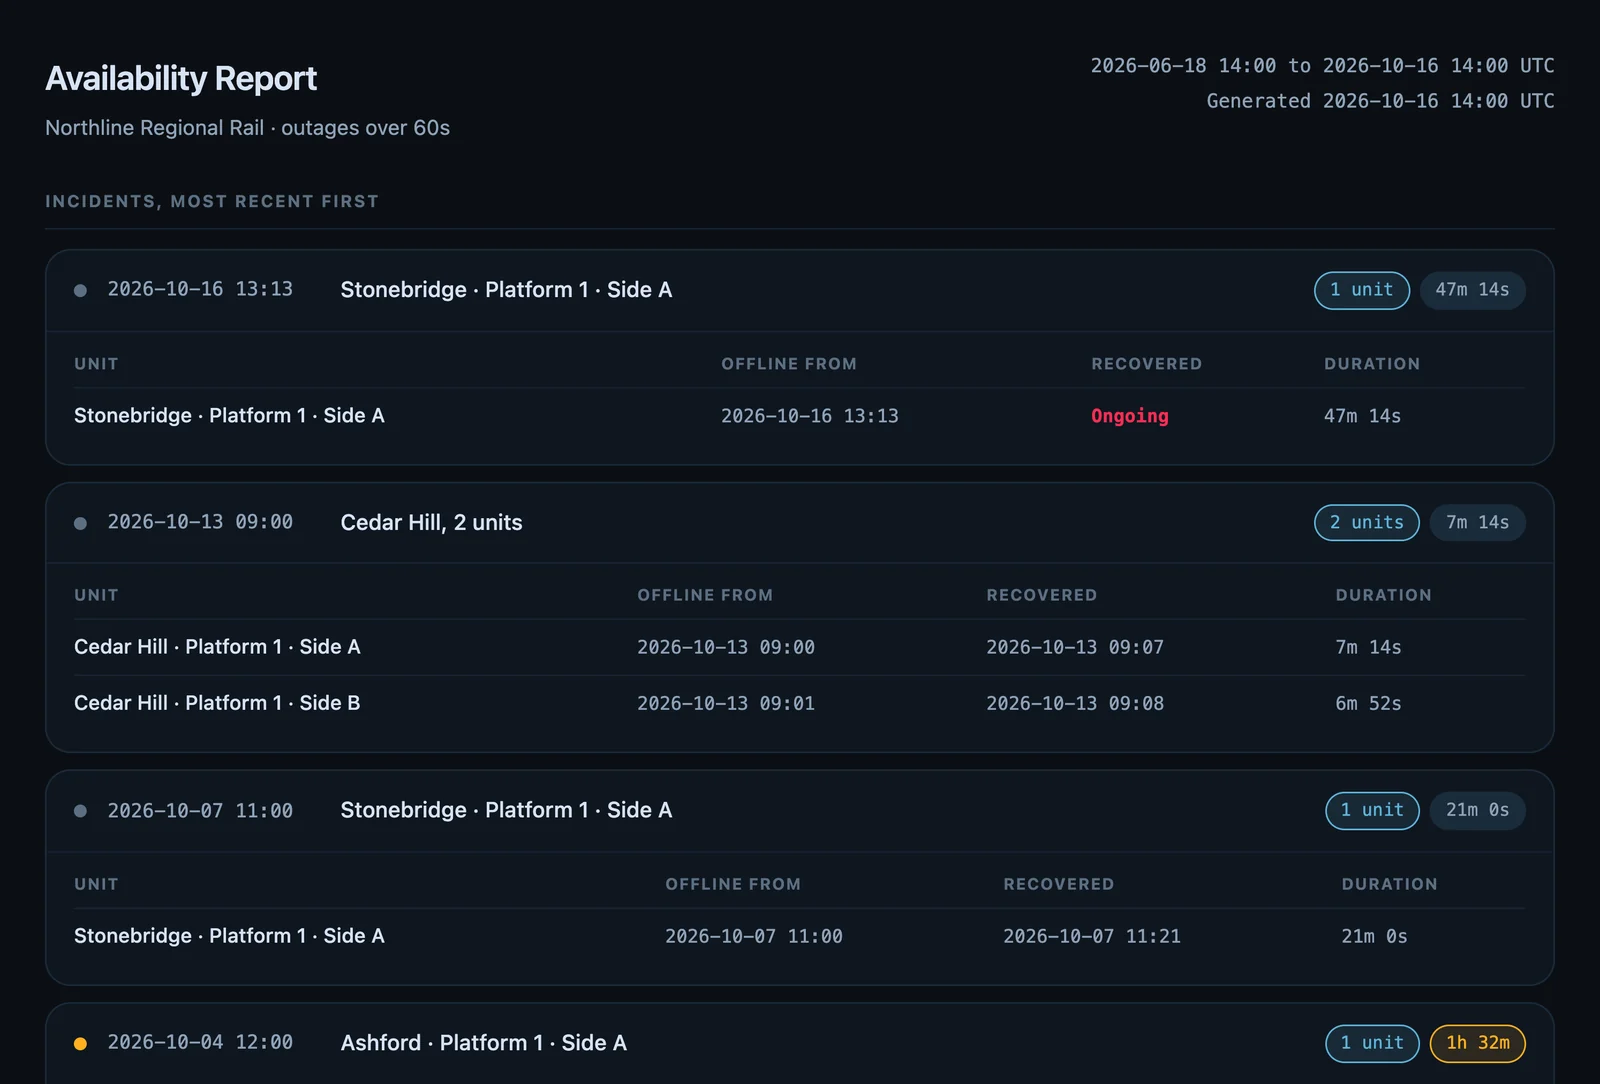 Demo data
Tells the feed from the player.
When a screen goes wrong, it shows whether the screen's player or the timetable feed behind it is the problem, so the right team gets the call.
Every unit on one map, and a wall view for the control room.
Status, last-seen time and recent history per display. Put the wall on any screen in the control room.
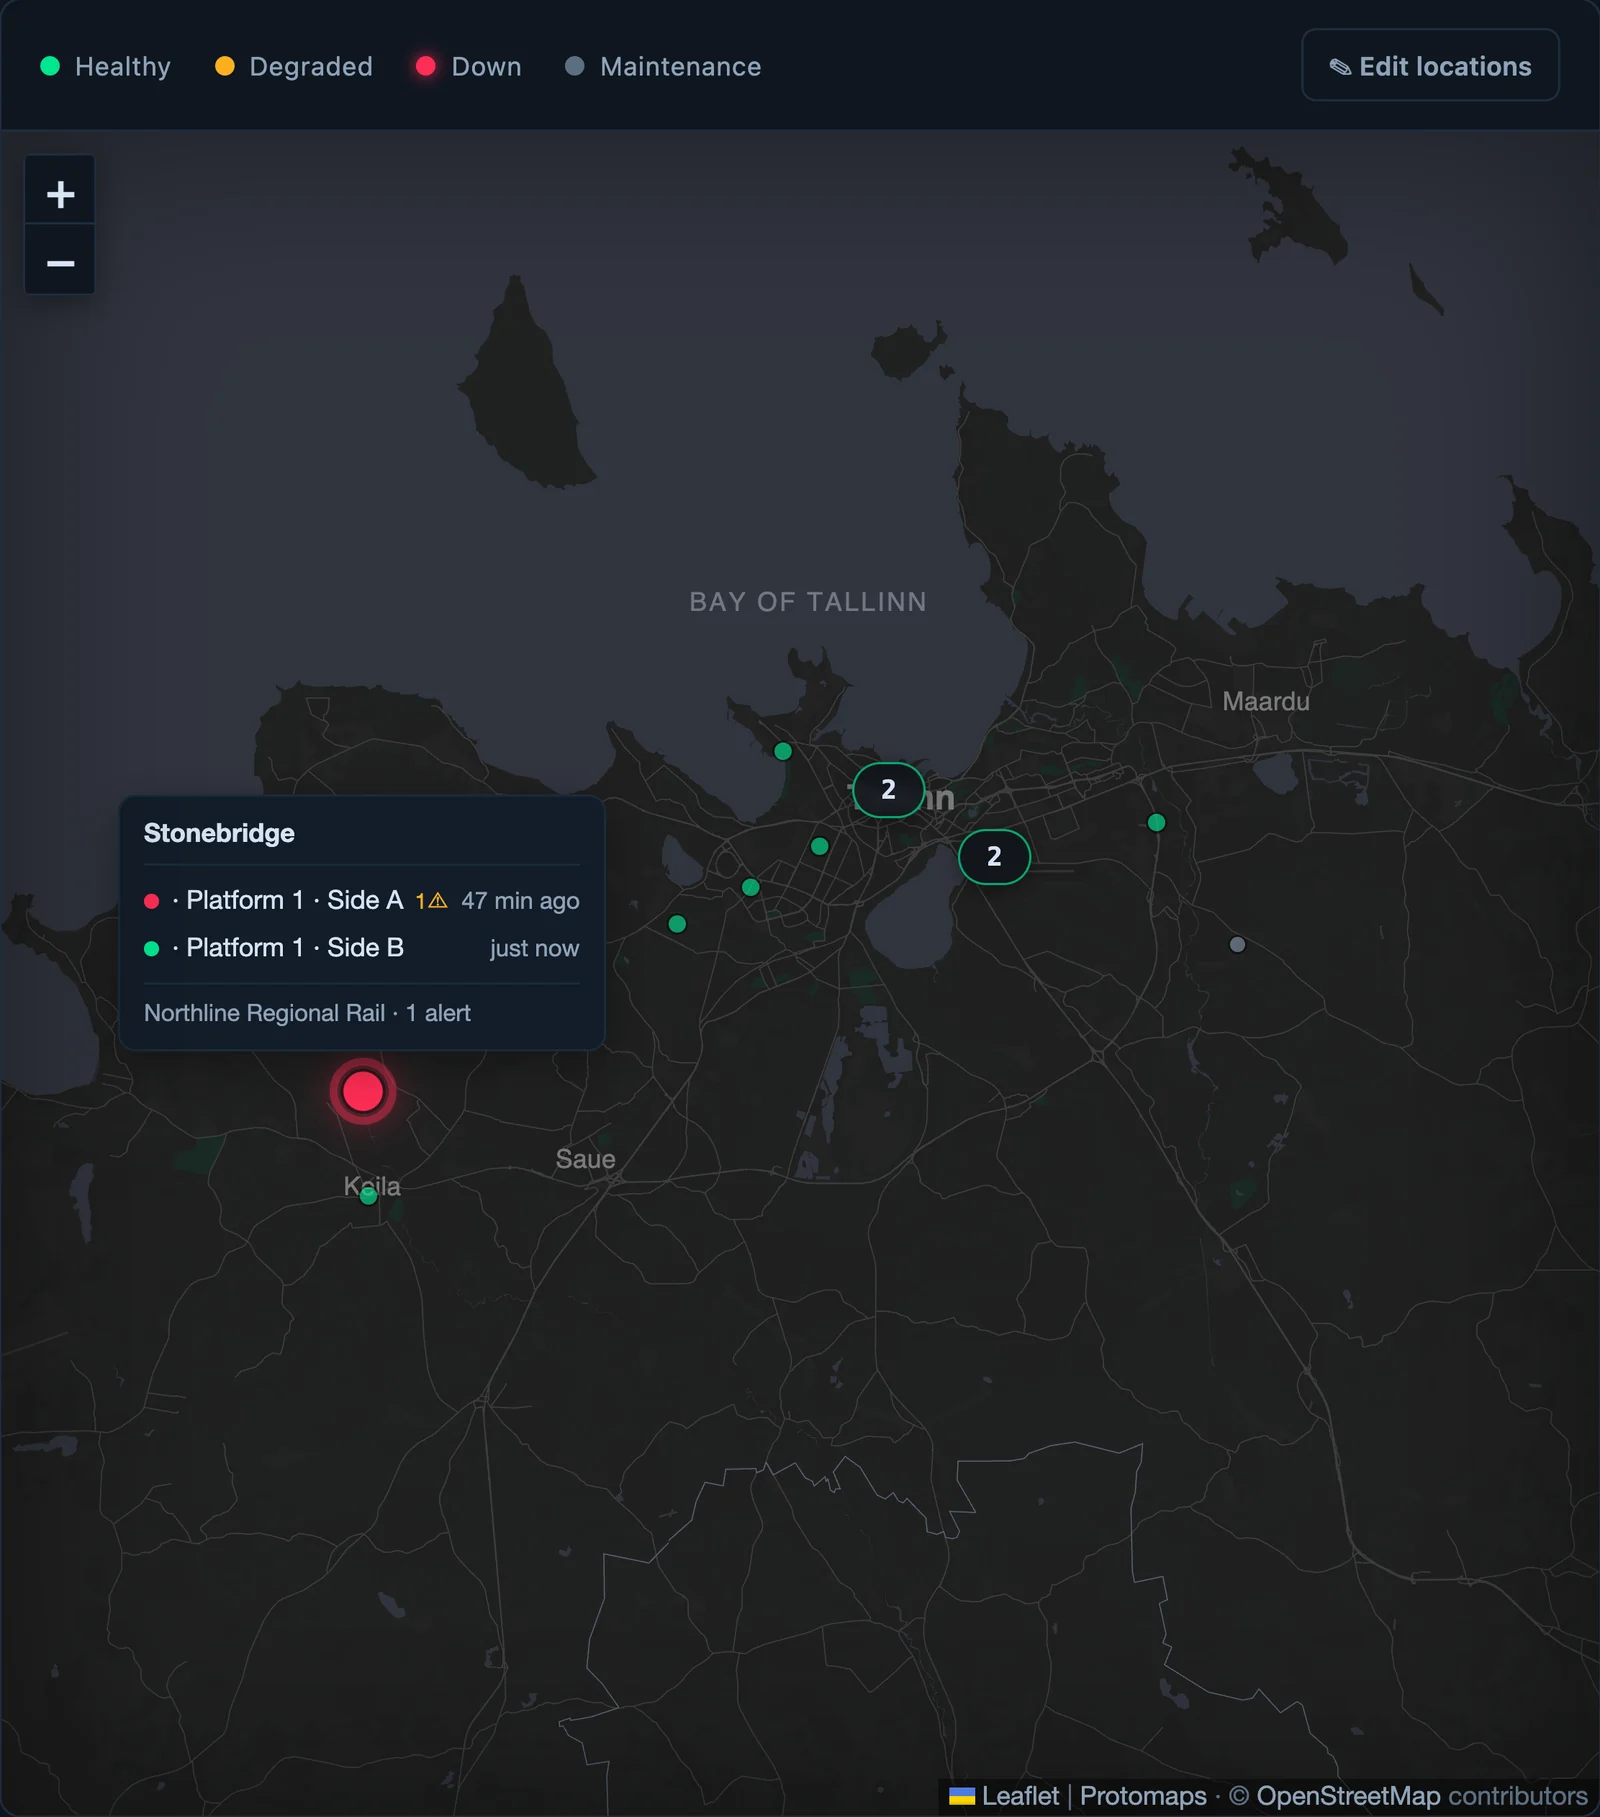 Demo data
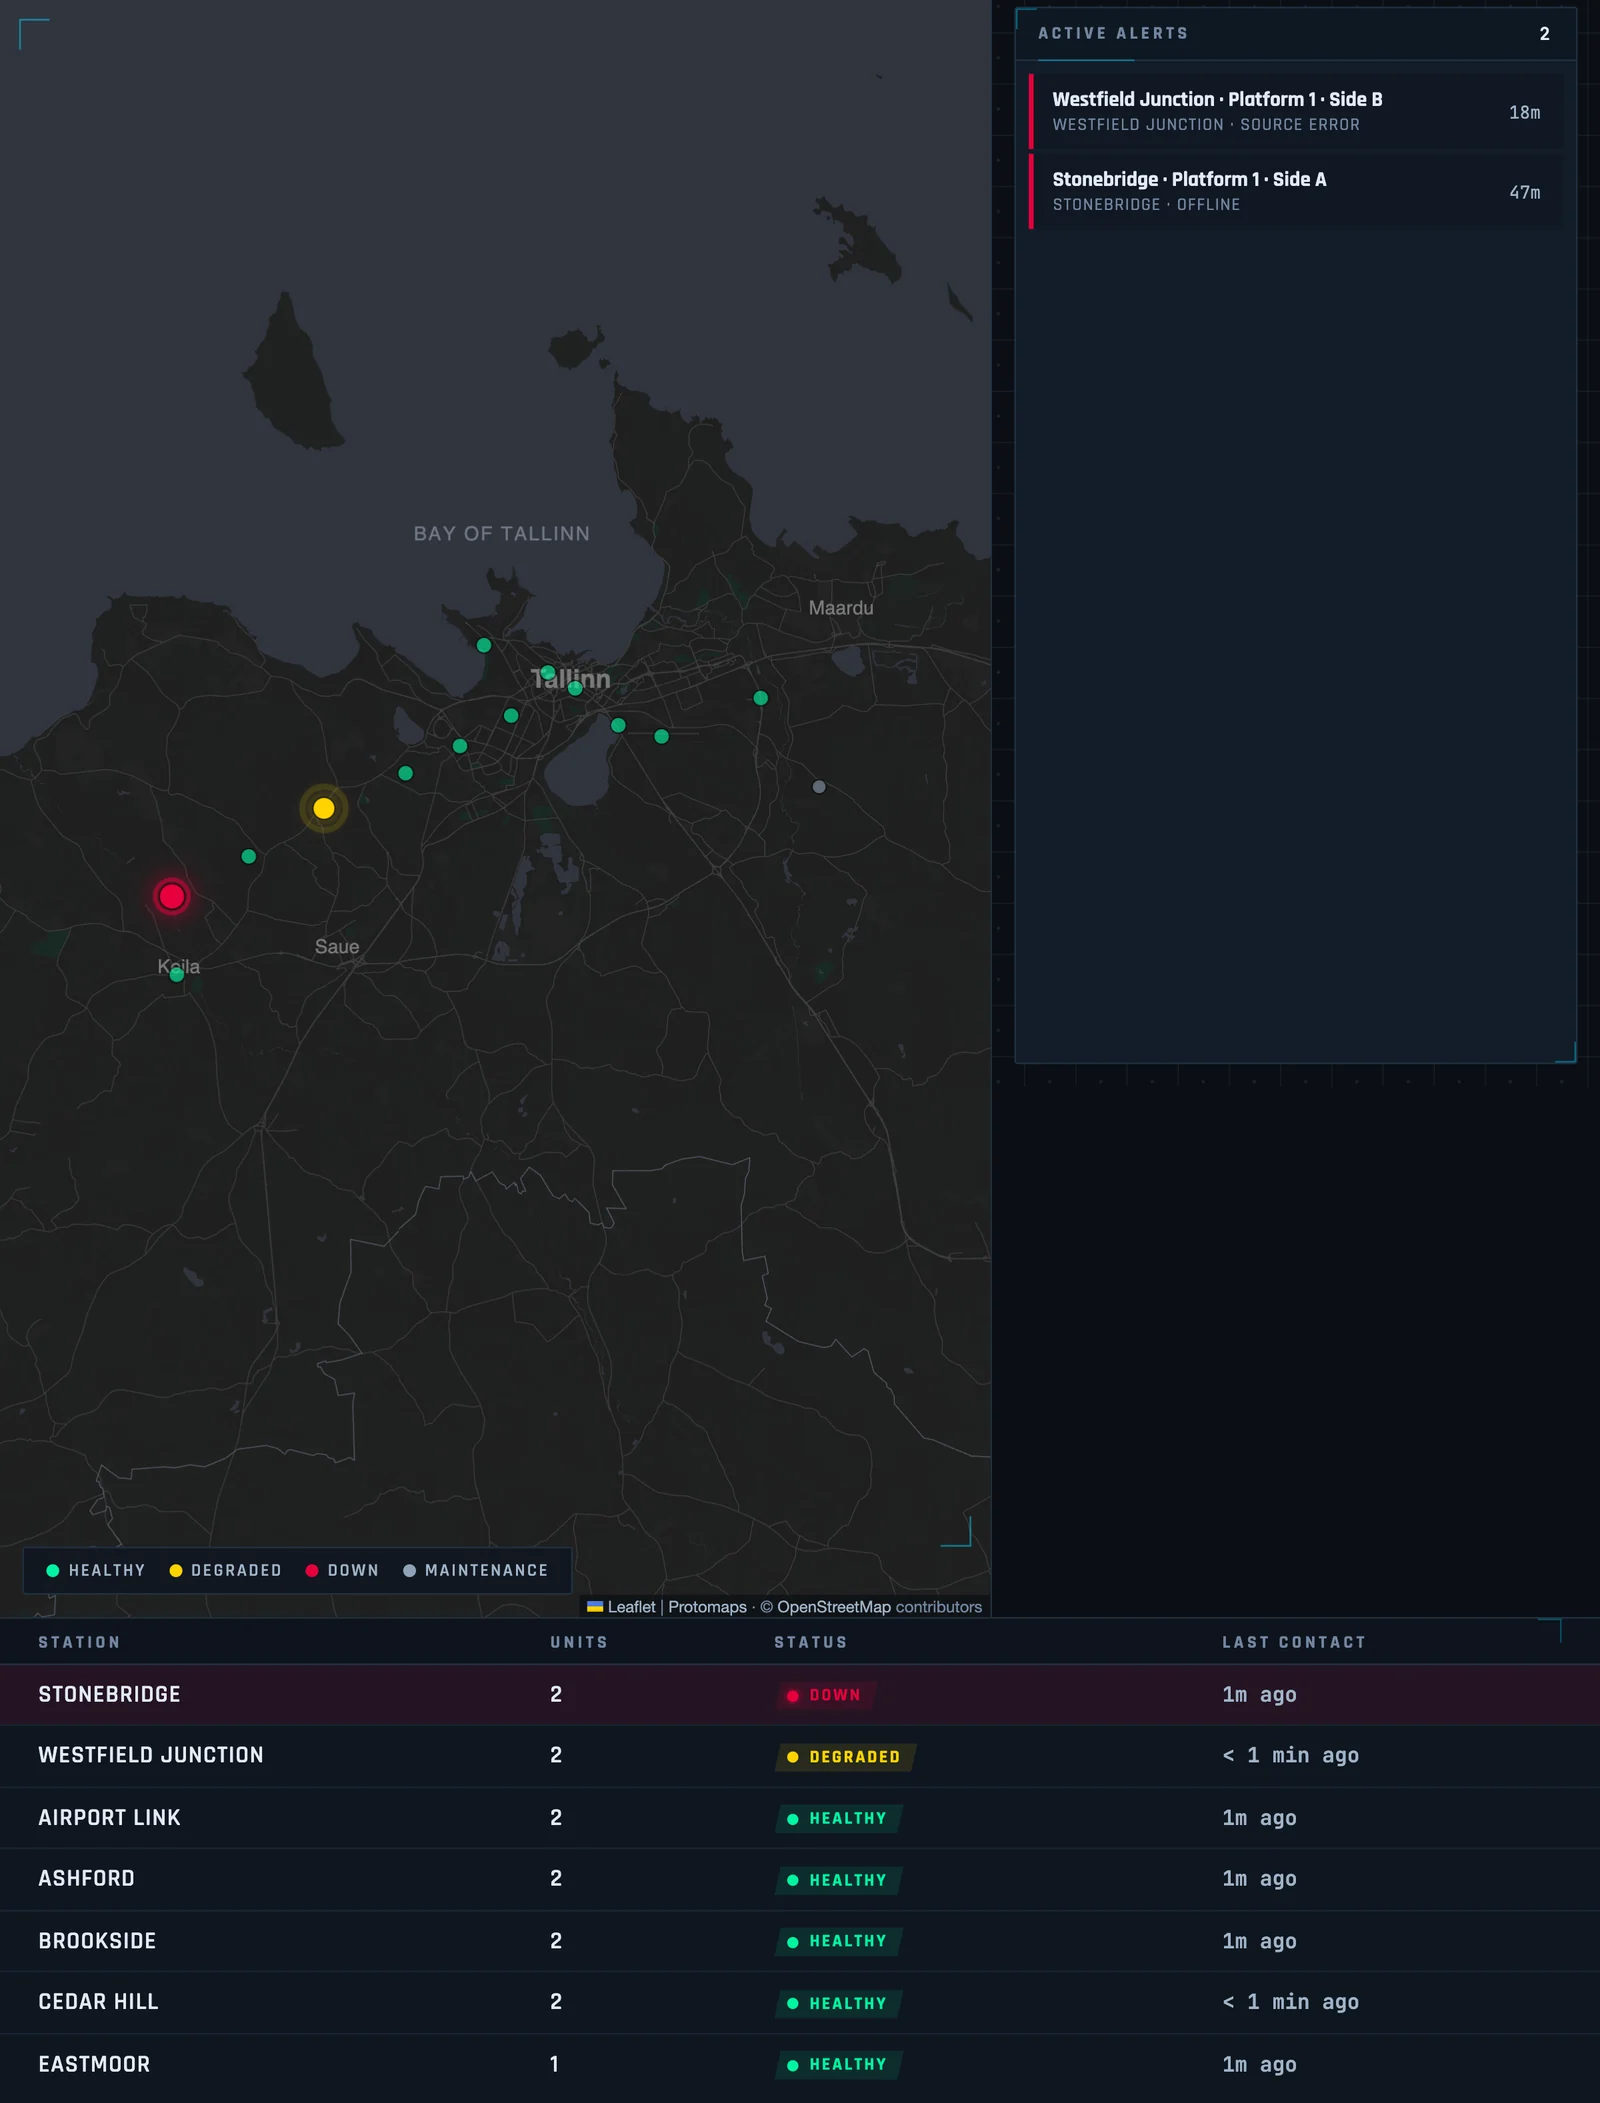 Demo data
A conversation attached to each screen.
A fault thread tied to the exact display, by email both ways: alerts and replies land in the same thread for that screen.
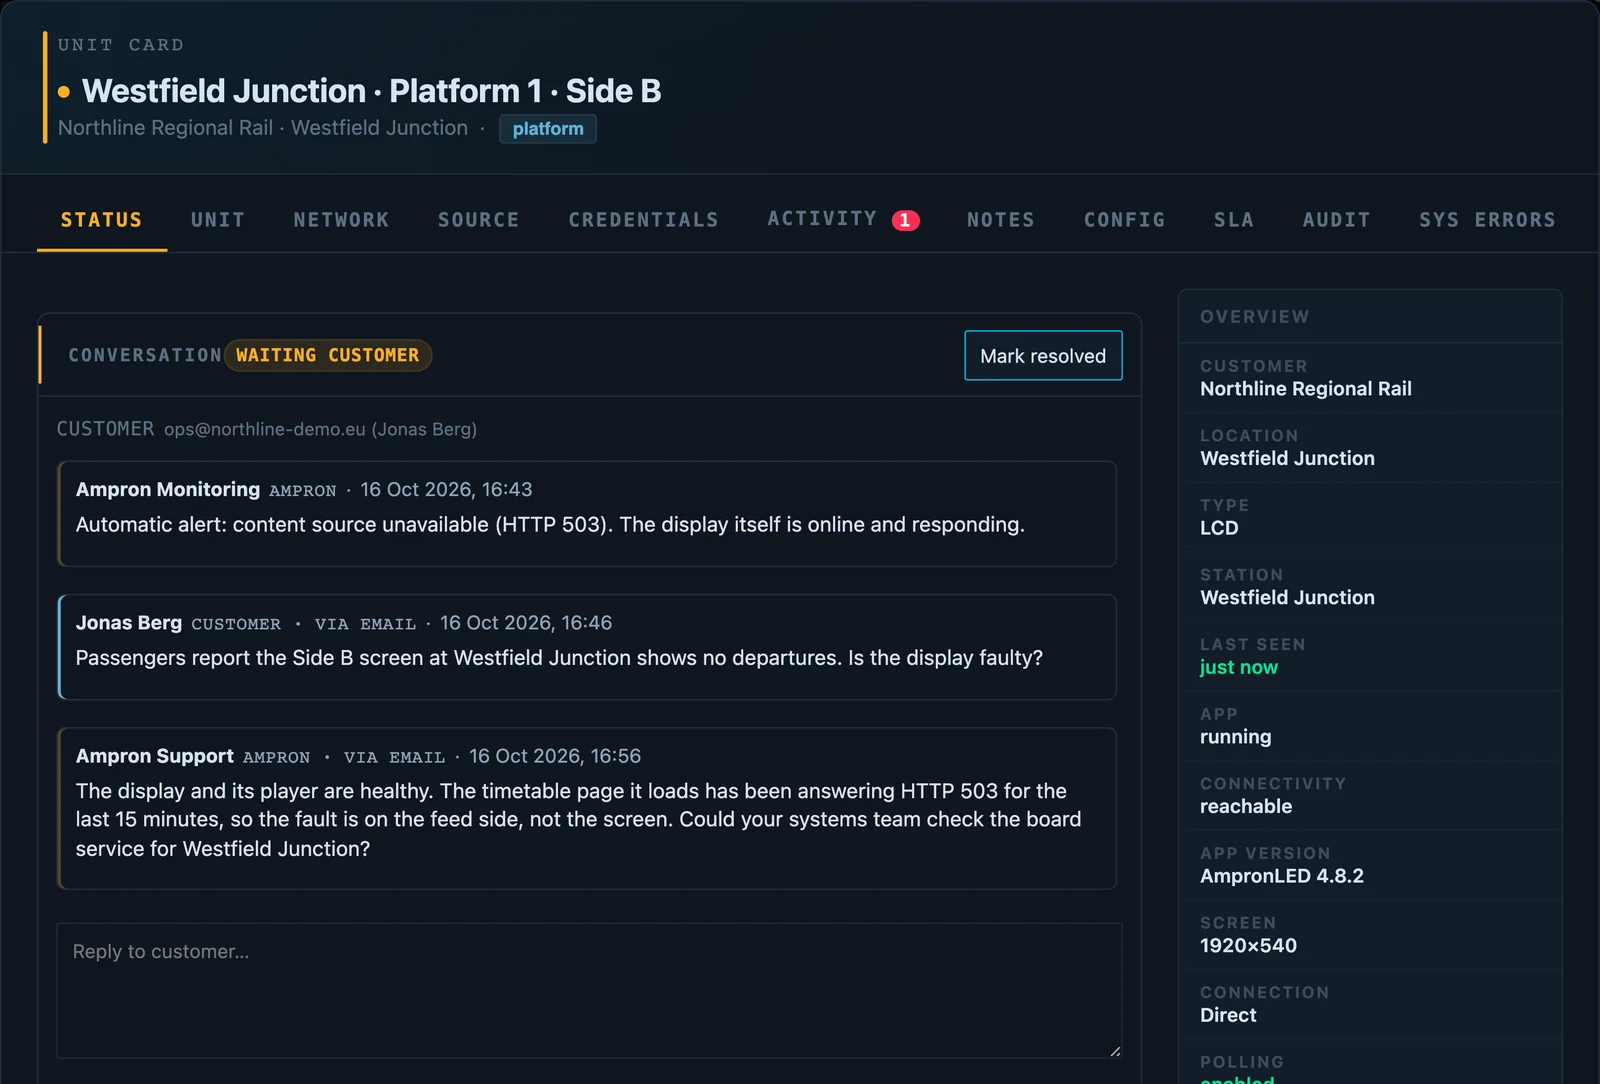 Demo data
Does it work with non-Ampron displays?
No. It is built for Ampron display controllers.
Is Ampron Monitoring a service you run for us?
No. It is software your own team uses, and it is being packaged to run on your own server. The software watches the screens; your people decide what happens next.
Tell us about your fleet
Licensed per site and per display, with yearly support and updates from Ampron.