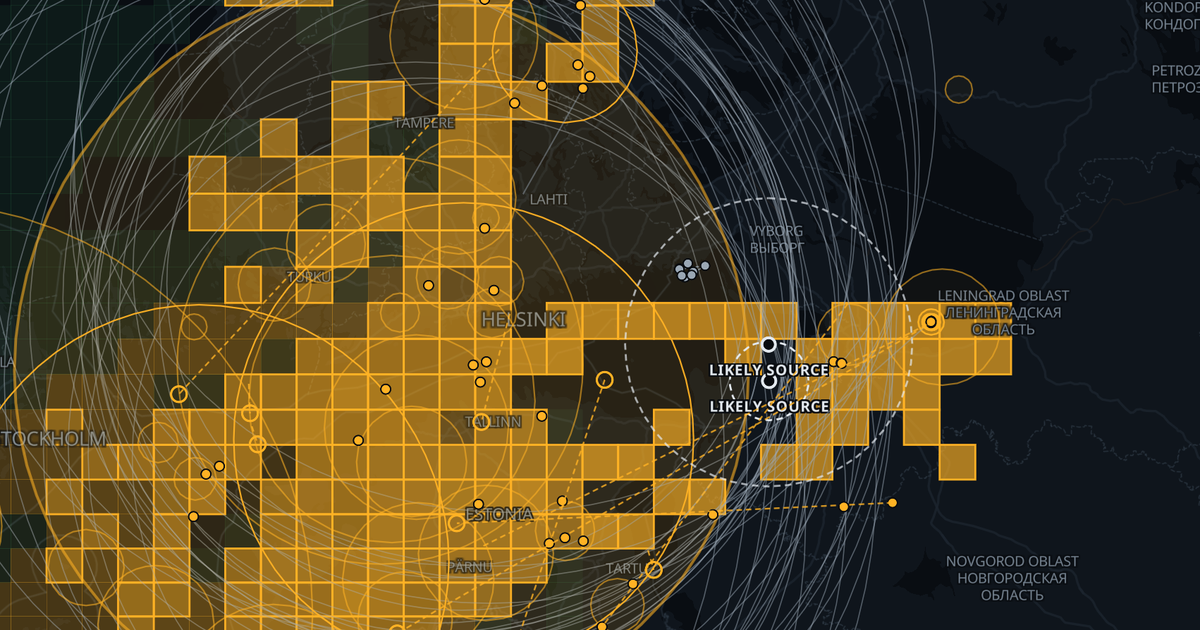
Since mid-2023, satellite navigation over the Baltic Sea has been jammed almost every day. Pilots flying into Tallinn, Helsinki, Riga and Vilnius regularly lose their GPS position for minutes at a time. On some routes they also see it replaced by a false one. Estonia's air navigation service has a standing NOTAM about it (A2223/26, valid until 13 November 2026): GNSS signal interference and/or spoofing can be expected in Tallinn FIR.
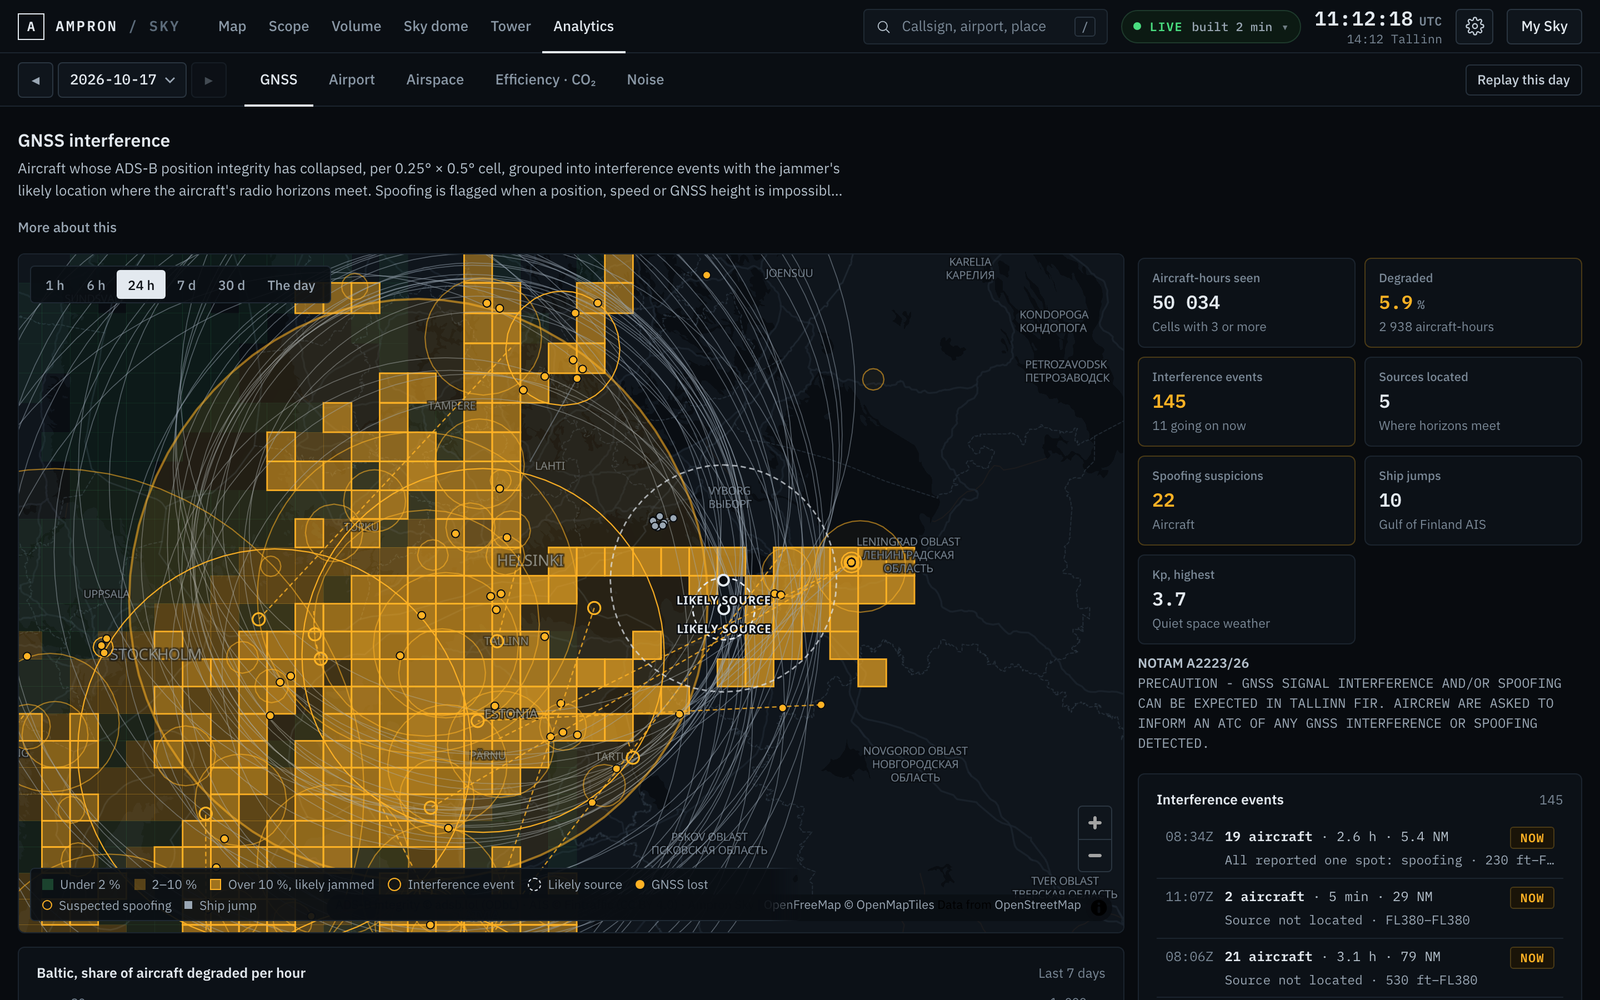
As of 17 October, the analytics page of Ampron Sky shows that interference as it happens. It shows where it is, how big it is, how long it lasts and how many aircraft it affects. It estimates where the jammer most likely stands, flags aircraft whose position looks faked, and warns about aircraft that are about to fly into it. It is free, needs no account, and is built entirely on open data.
Why this matters beyond aviation
GNSS is not just for aircraft. Ships, trains, the clocks in mobile networks, and the timing in many control systems depend on the same weak satellite signals. A jammer strong enough to blind an airliner at 37 000 ft over the Gulf of Finland also reaches ships and infrastructure on the coast below.
The information about this interference is usually split up. Pilots report some of it, when they have time to. Authorities measure some with their own equipment. Commercial surveillance companies sell the rest to air navigation service providers. A public map mostly shows daily averages, and those hide the short bursts.
We wanted a view that anyone with a browser can open. It should show events rather than averages, say how certain each estimate is, and explain how it was made.
What you see
Interference cells. The map is divided into cells of about 28 × 28 km. Each cell shows the share of aircraft whose position integrity has collapsed, per hour. One aircraft with old avionics is noise. Many aircraft losing their position in the same place at the same time is jamming.
Interference events. Losses are grouped into events: their start, end, size, how many aircraft they affected and at which altitudes. An event marked NOW is still going on.
Likely source. Where the data allows it, the page draws a ring where the jammer most likely stands, with how far the equally good answers spread. When the data is ambiguous, for example with two jammers at once, it leaves the source blank rather than guess.
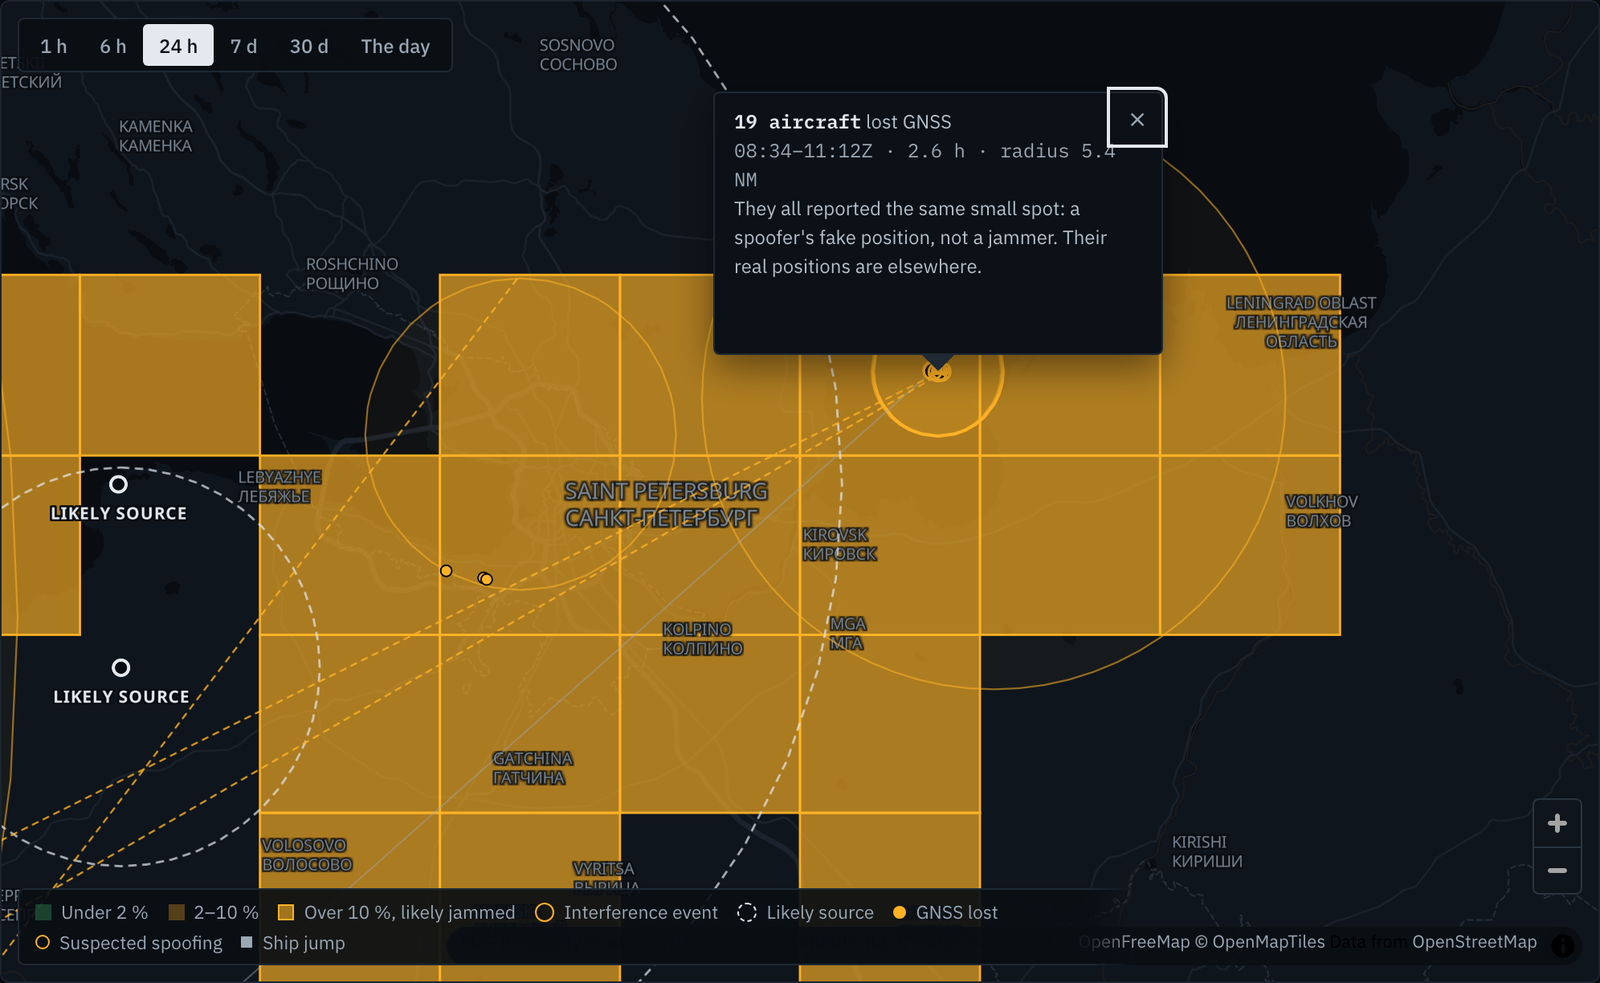
Spoofing. Aircraft whose reported position is impossible: one that jumps further than it could fly, a ground speed that doesn't fit its airspeed, or many aircraft "parked" on one spot at cruise altitude.
Ships. Fintraffic's open AIS feed adds about a thousand ships in Finnish and Estonian waters, watched for the same kind of impossible jumps.
Context. The planetary Kp index tells you whether a geomagnetic storm, not a jammer, could explain a bad hour. Estonian GNSS NOTAMs are listed alongside.
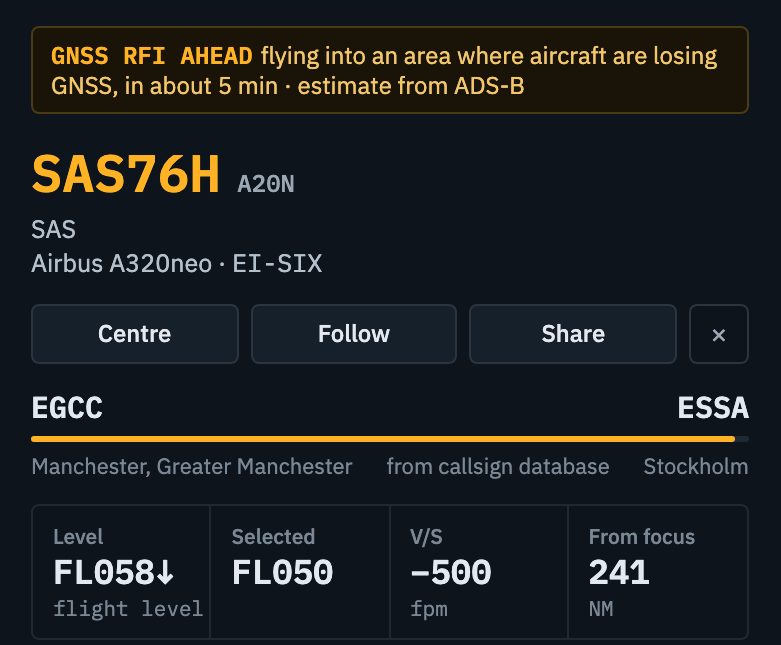
On the live map, aircraft get tags: GNSS LOST, SPOOFED?, and GNSS RFI AHEAD. The last one means the aircraft's track for the next ten minutes runs into an area where other aircraft are losing their position.
How it works
Every airliner broadcasts its position several times a second over ADS-B. With each position it sends two quality figures: how accurate the position is (NACp) and how far it is guaranteed to be from the truth (NIC). A healthy airliner reports NIC 7 to 8. When its GPS receiver is jammed, the figures collapse to zero within seconds, or the position stops altogether. Ground receivers run by volunteers pick all of this up and share it through adsb.lol, an open network. In effect, every aircraft in the sky becomes a GNSS interference sensor.
Turning that into events and a source location follows a method published in 2023 by Dr Matthias Schäfer of SeRo Systems, together with Estonian Air Navigation Services and the Estonian Consumer Protection and Technical Regulatory Authority (Jammer on the Horizon, ION GNSS+ 2023). We implemented it from the paper:
- Clean the data. Most losses aren't jamming. Aircraft that are degraded wherever they fly, while everyone around them is fine, have their own avionics problem and are dropped. So are losses during steep turns, when the antenna on top of the fuselage looks away from the sky.
- Group the rest. Losses of different aircraft within 50 km and 30 minutes of each other become one event, and an event needs at least two aircraft.
- Find the jammer. A powerful jammer blinds GNSS out to its radio horizon, the point where the Earth's curve hides it. When an aircraft loses or regains GPS, it is crossing that horizon. Horizons work both ways, so at that moment the jammer lies on a circle around the aircraft: for an aircraft at FL370 and a jammer on a 50 m mast, a circle with a radius of about 470 km. Each crossing draws a circle. Where three or more circles meet is the likely source.
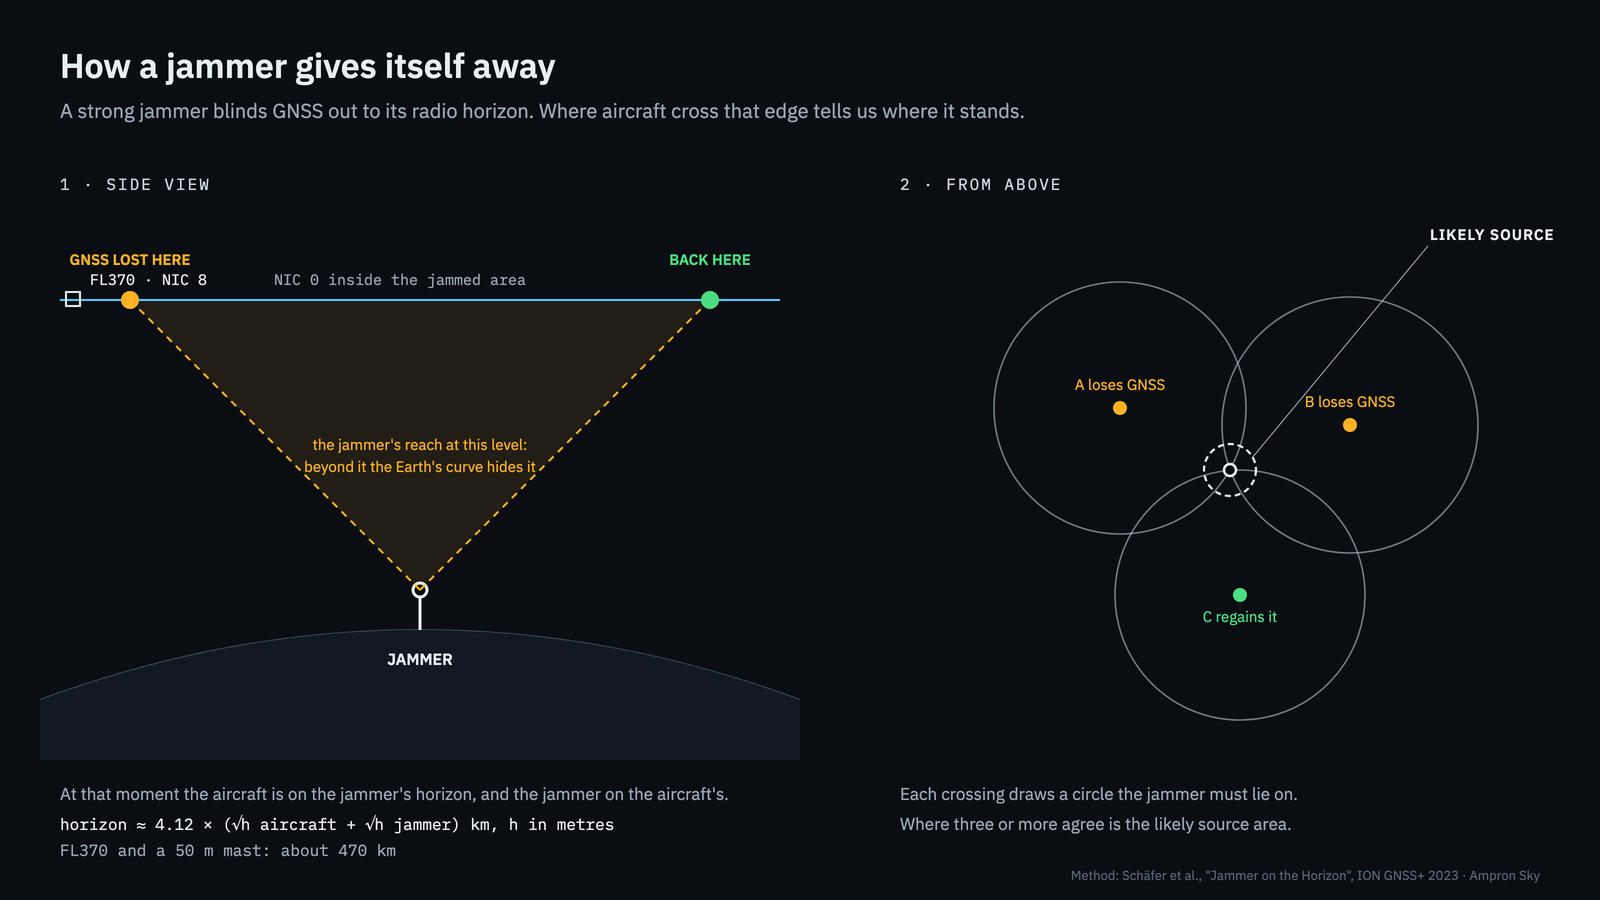
On a simulated jammer, our implementation finds the source to within a few kilometres. Real data is noisier, and the page shows the uncertainty with every estimate.
One finding came from our own data. When an aircraft's GPS position disappears, the open network often keeps showing the aircraft by multilateration: it times the aircraft's transponder signals at several receivers instead of trusting its GPS. Those aircraft are precisely the jammed ones. A simple filter that keeps only GPS-based positions throws them away, which undercounts the worst interference. Ampron Sky counts them.
What the first day showed
We ran the method over the first 36 hours of our archive, 16 and 17 October 2026. Figures are from 17 October at 11:15 UTC.
- About 50 000 aircraft-hours were observed over the Baltic and nearby in 24 hours. 5.9 % of them had degraded GNSS, and 479 cells passed the 10 % mark that we treat as likely jamming.
- About 145 interference events were found in 24 hours. Most were short: the median lasted about 20 minutes, and more than eight in ten were over within the hour. The largest event over the Baltic affected 68 aircraft across the Gulf of Finland for more than three and a half hours on the night of 16–17 October.
- On both nights, the Gulf of Finland's largest events pointed to the same area: the southern coast of the Gulf of Finland west of St Petersburg (around 59.7 to 60.0°N, 29.1°E). The uncertainty ring ran from 31 to 112 km.
- Another source area came out on the Kaliningrad coast (around 55.1°N, 21.0°E, ±54 km).
- On the morning of 17 October, 19 aircraft reported the same small spot east of St Petersburg for about two and a half hours. They were not there: this is a spoofer's fake position, and the page labels it as spoofing rather than a jammer.
These are estimates from public data. They show where the circles meet, not who operates a transmitter. The page states every limit openly. The method assumes one strong jammer at a time. Crowdsourced coverage has gaps. ADS-B only reveals the GPS L1 signal, not the other frequencies.
Why a display company built this
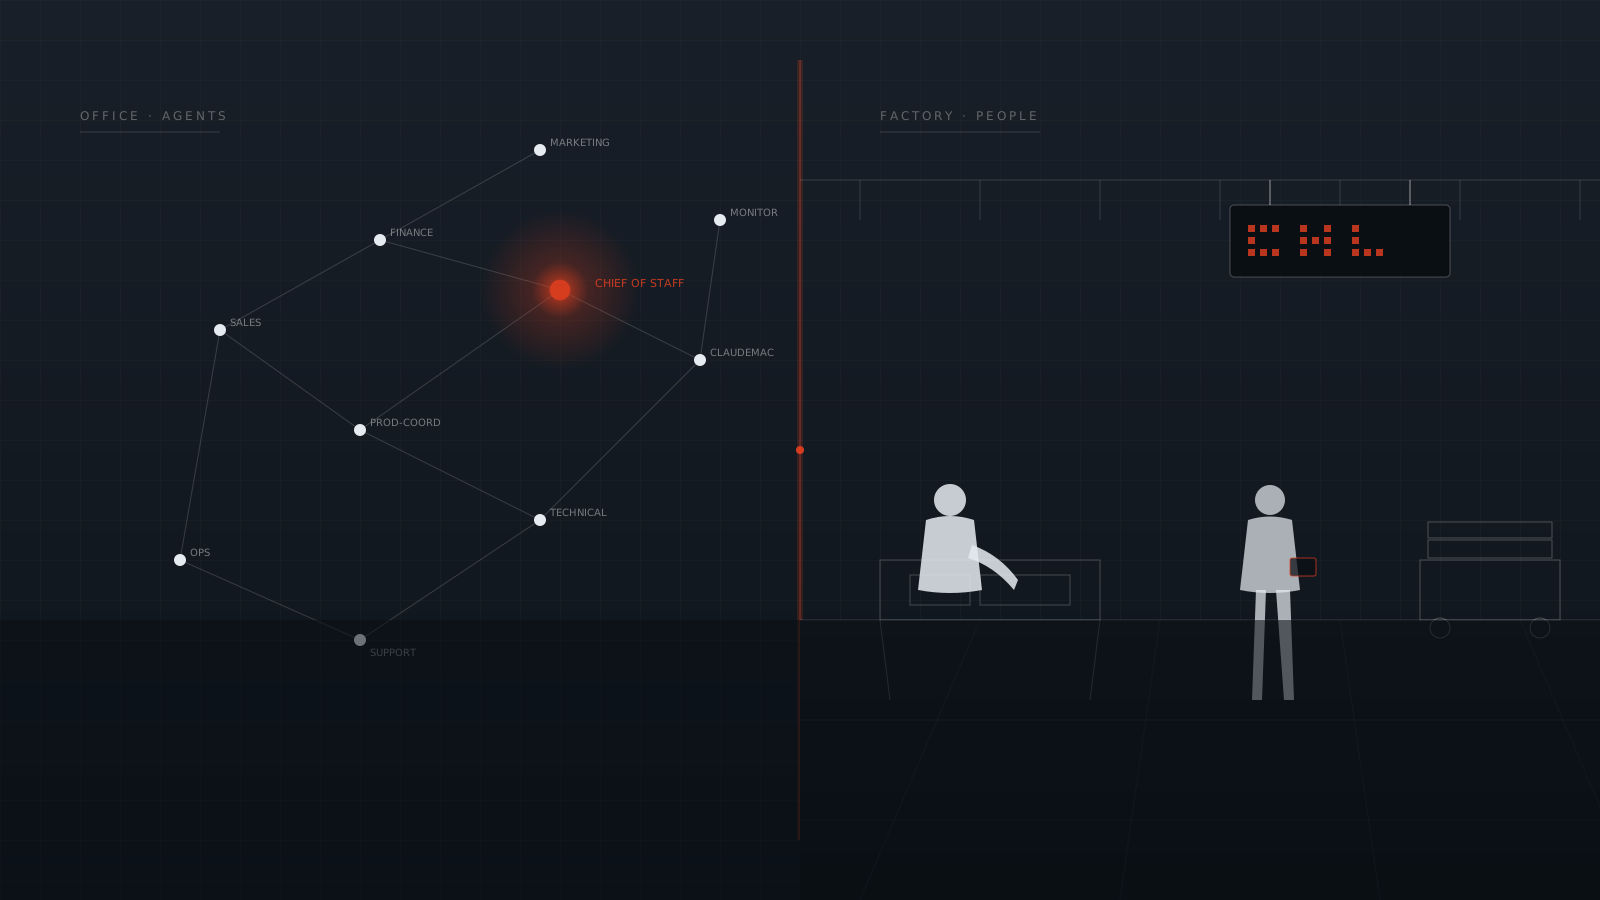
Ampron builds displays for airports, ports, railways and cities. Every one of them shows live data from someone else's system, and the hard part is never the pixels. It is knowing whether the data behind them can be trusted right now. GNSS interference is a good example. It is invisible on the ground, it comes and goes in bursts, and it affects anything that relies on satellite position or time.
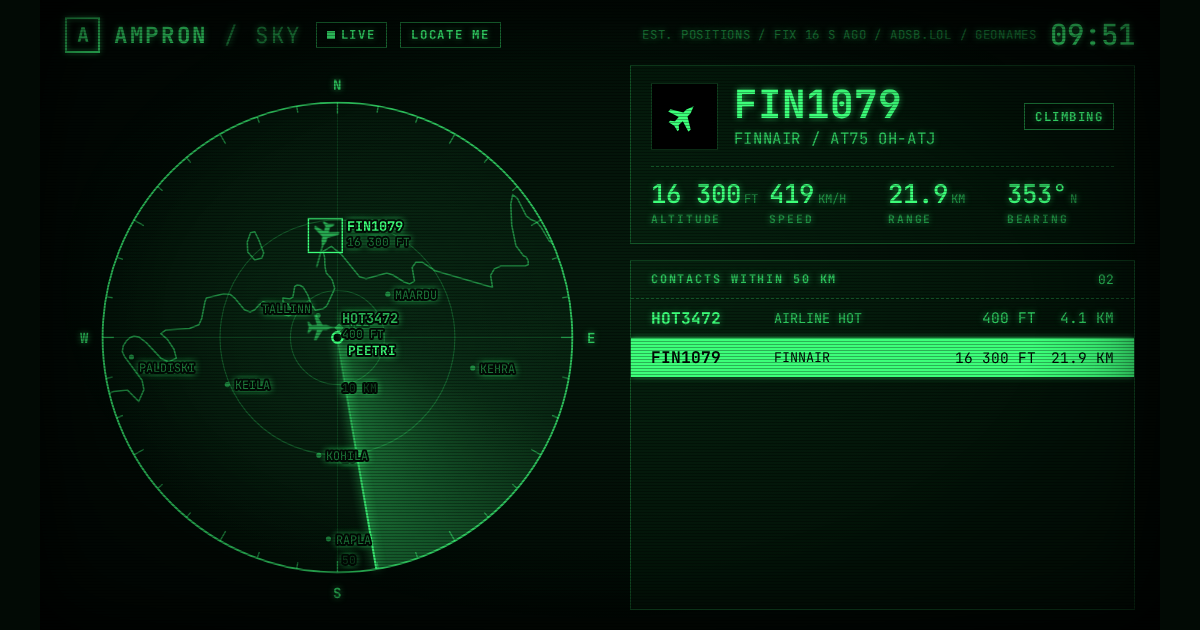
Ampron Sky started as a radar for our office wall in Peetri, near Tallinn Airport (the story). The interference analytics went from research to a live feature in one day, 17 October 2026. Ampron's AI Executive team built it together with Gen Vagula, our CEO: reading the published methods, testing them against simulated and real data, and shipping them. The same way of working runs the rest of our company.
We are also building our own receiver in Peetri. It will add the ground coverage around Tallinn that the volunteer network lacks.
If you run an airport, a port or a control room and want an interference picture like this on a wall display, or behind your own systems, tell us about it.
Data: ADS-B © adsb.lol contributors (ODbL). Ships: Source: Fintraffic / digitraffic.fi, license CC 4.0 BY. Kp index: NOAA Space Weather Prediction Center. NOTAMs: Estonian Air Navigation Services. Method: Schäfer, Sõeruer, Kippak, Sadrak, "Jammer on the Horizon: A Robust Method for GPS Jammer Localization Using ADS-B Data", ION GNSS+ 2023. Ampron Sky shows estimates from public data. It is not for operational use and not for navigation.