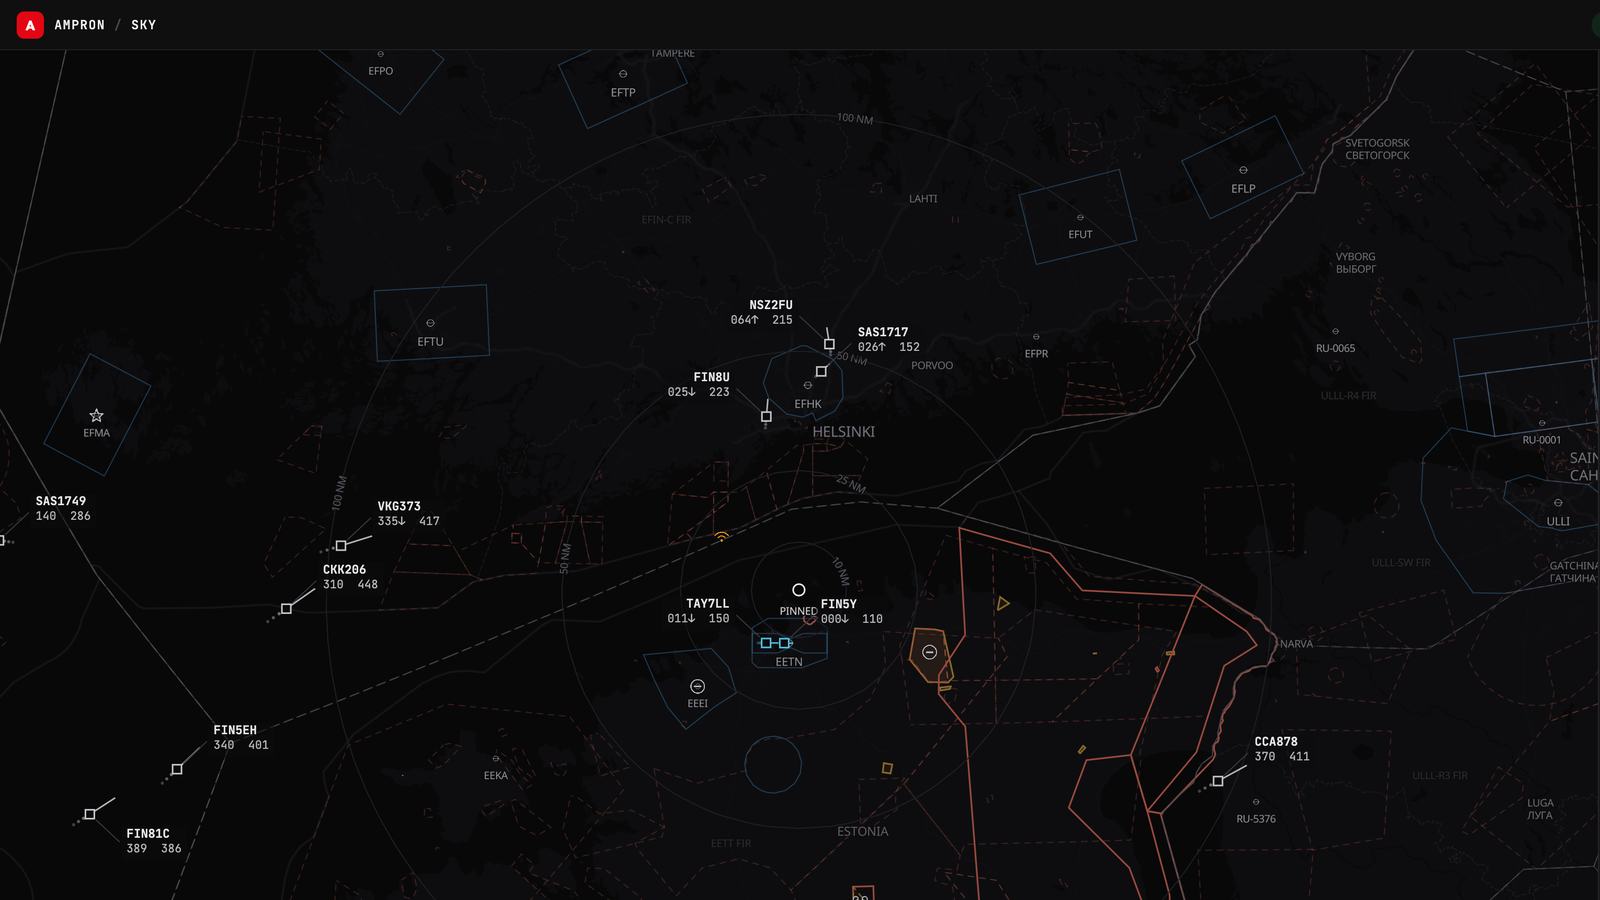
On 12 October we built a small radar for the wall of our office in Peetri, near Tallinn Airport. It showed the aircraft within 50 km, drawn like an old green-phosphor scope, and it was meant as a test card for our displays: something live to show when there is no customer content yet. The first version of this article told that story.
Ampron Sky has kept growing since. At version 1.8.0 it is a free web application that shows air traffic the way an air traffic controller would recognise it, with airspace, NOTAMs, aviation weather, GNSS interference and airport performance in the same place. It needs no account, has no ads, and runs in any browser on a desk, a phone or a wall. The green scope is still there, as the Phosphor theme.
Five ways to look at the sky
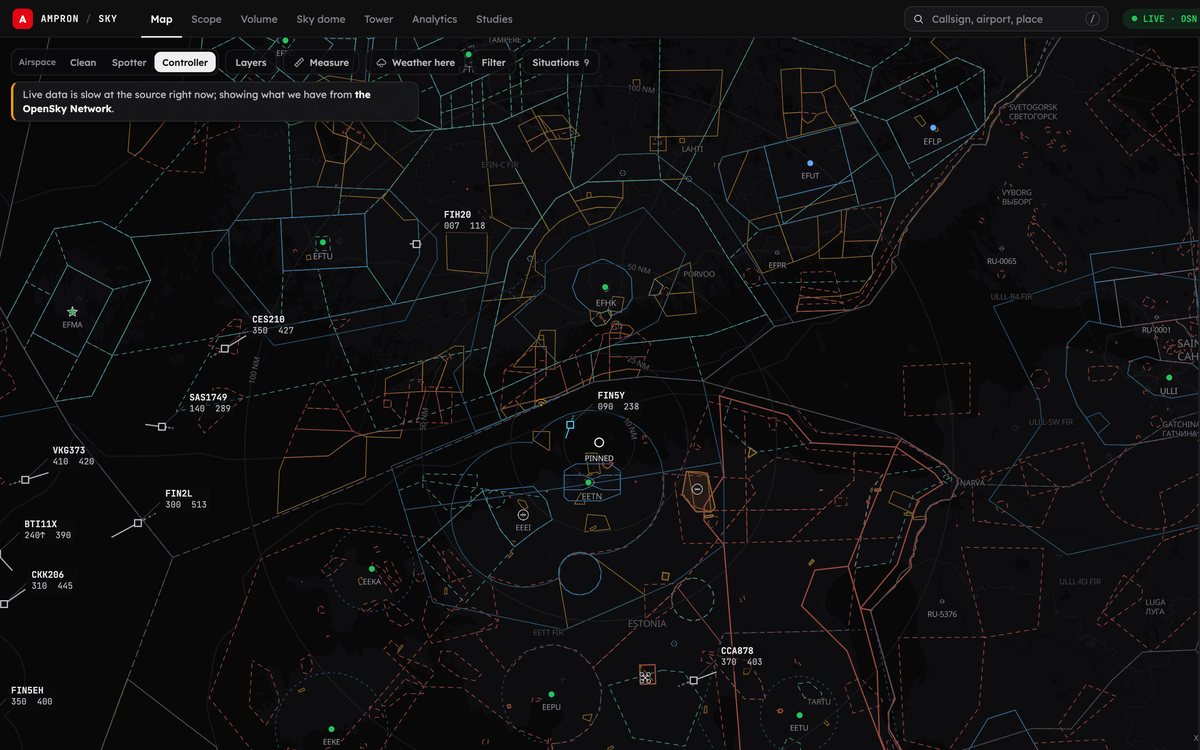
Map. Live aircraft within about 250 nautical miles of the place you choose, with a worldwide snapshot beyond that circle. Each aircraft is drawn as a silhouette of its kind: airliner, wide-body, turboprop, helicopter, light aircraft, fast jet. Controllers' boxes are one setting away. Layers add airspace, navaids, obstacles, the areas NOTAMs have switched on, weather, ships and drones.
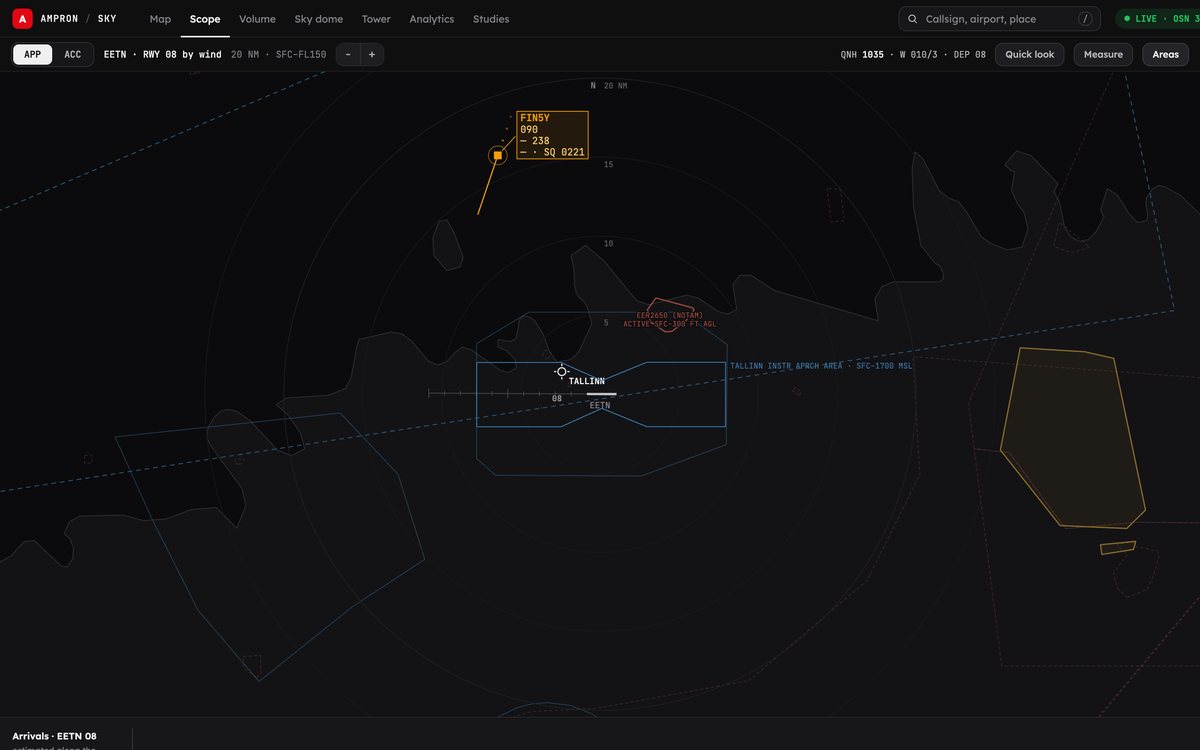
Scope. An approach or area-control radar position, each with its own level band and range, data blocks on every aircraft and an arrival timeline.
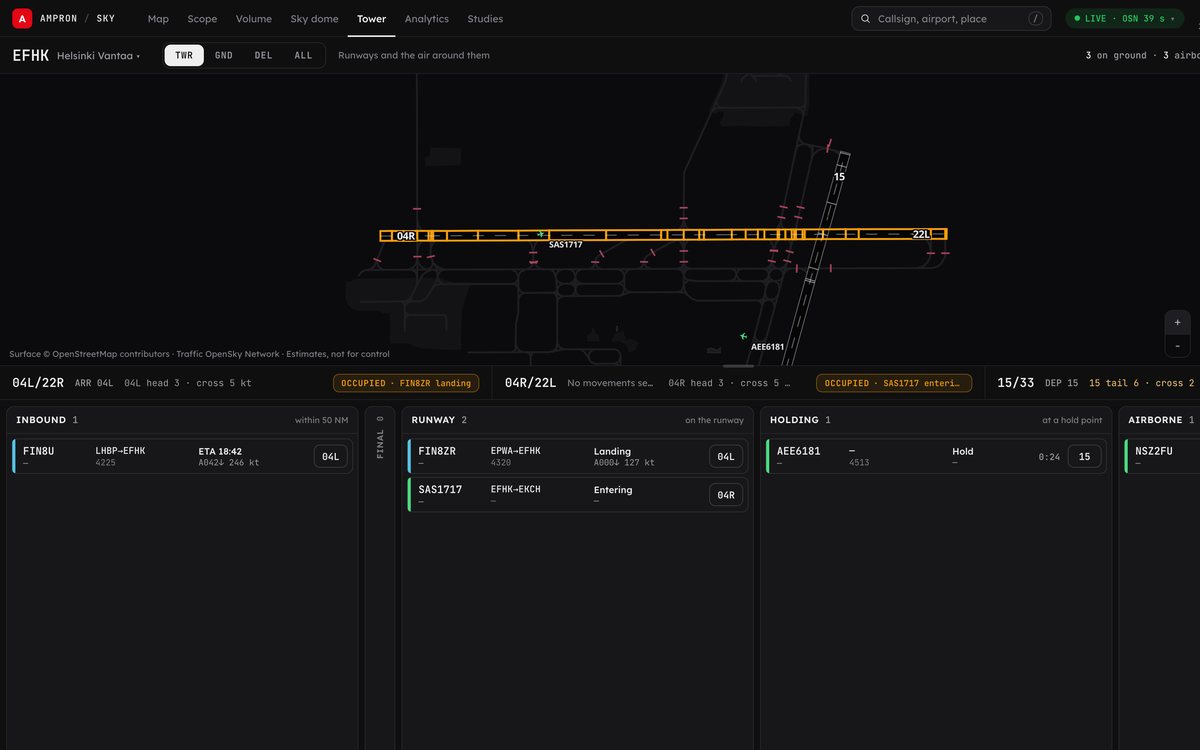
Tower. An aerodrome controller's working position, built from public ADS-B: the airport surface, approach radar out to 60 NM, an arrivals board and electronic flight strips. Each strip moves through inbound, final, landing, taxi, stand, pushback, lined up and take-off as the aircraft's own track says it should. It reads the picture; it controls nothing.
Volume. A 3D block of airspace, 65 × 65 NM with the height stretched three times, that you orbit with a finger or a mouse. Curtains show where each aircraft was over the last two minutes, and dots show where it will be over the next two.
Sky dome. Point your phone up and see what is overhead, including the satellites passing too: the space stations, the bright ones, Starlink trains and the navigation satellites themselves.
Honest about its own data
Ampron Sky shows data from other people's systems, and it says so at every step. Positions come from volunteers' receivers, shared through adsb.lol, with The OpenSky Network filling in when adsb.lol doesn't answer. The picture is live, updated every minute or two, and a small chip tells you how old it is and which network it came from.
Between fixes, aircraft are carried forward along their last track, and that stops after a minute. An aircraft you follow out of coverage carries on as a hollow, dashed estimate labelled EST, and that estimate never enters the archive, the statistics or the alerts. If your connection drops, the map keeps its last picture, greyed out and stamped with its time. On a wall screen, stale data puts up a red banner saying the screen is not showing live traffic.
A missing hour is shown as missing, never as zero traffic. Estimates are labelled as estimates. Tags such as HOLDING, GO-AROUND and DIVERTING? are read from the traffic, and say so. Ampron Sky shows what aircraft broadcast and what that adds up to; it doesn't guess at causes or intent. It is not for navigation or operational decisions.
GNSS interference over the Baltic
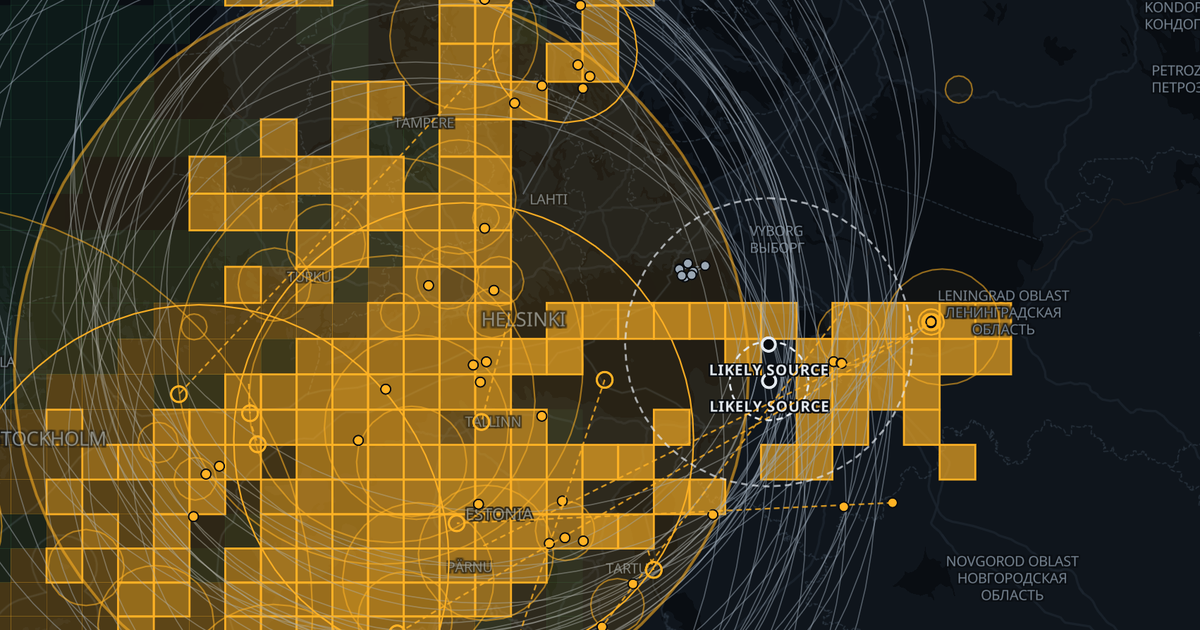
Satellite navigation over the Baltic Sea is disrupted almost every day. Every aircraft reports how sure it is of its own position, and when the satellite signal is jammed those figures collapse. Ampron Sky turns that into a daily picture: where it happened, how many aircraft were affected and for how long, and, where the data allows, the likely source area. The method follows the one SeRo Systems published with Estonian Air Navigation Services and the Consumer Protection and Technical Regulatory Authority ("Jammer on the Horizon", ION GNSS+ 2023). We explained how it works when it launched.
On 17 October 2026, more than half of the aircraft Ampron Sky recorded over the Baltic lost satellite positioning for a while: over 300 hours in all. Each flight gets its own line, such as "Lost GNSS for 14 min over the Gulf of Finland", and the daily page keeps an archive back to 16 September 2026. It locates areas. It says nothing about who is jamming or why.
Weather a pilot would read
Rain radar from the European OPERA composite with the Finnish, Danish and Estonian national radars drawn over it, lightning from the last hour, a rain nowcast for the next two hours, decoded METAR and TAF, SIGMETs, and winds and temperatures aloft by flight level. Tap any point for the forecast, the nearest METAR and the radar value there. Where two forecasts exist, they are shown side by side, never averaged.
Airspace and situations
Estonian NOTAMs, airspace-use plans and drone zones come from EANS, Nordic and Baltic NOTAMs from the region's air navigation services, and the rest of the world's from the FAA's NOTAM service. A time selector shows what the airspace will do next: solid red for a restriction active now, dashed amber for one that starts later.
The Situations list gathers airport and airspace closures, drone NOTAMs, holding, diversions, military activity patterns and GNSS interference. Each item says how it is known: from a NOTAM, read from the traffic, or entered by hand from a public report.
For anyone who wants to know what's flying
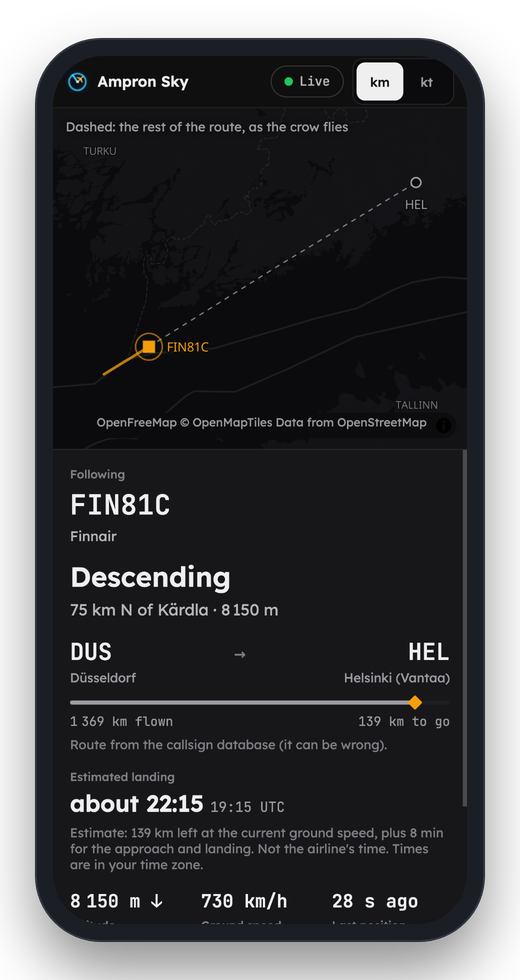
Type the flight number from your ticket and Ampron Sky finds the aircraft, even when it flies under the airline's radio callsign rather than the number printed on the ticket. Send the family a follow-my-flight link: it shows where the flight is and an estimated landing time, labelled as an estimate, on any phone, with no app and no account. Search a type such as "C-17" and follow every match worldwide. Set free push alerts for one aircraft, for military traffic, or for activity near a place you choose. Rare arrivals lists the unusual aircraft landing at an airport in the next hour, and Replay plays back any recorded hour of Baltic traffic at up to sixty times speed.
An account is optional and free. Sign in with an e-mailed link or a passkey, and your alerts and settings follow you between devices.
For airports and air navigation
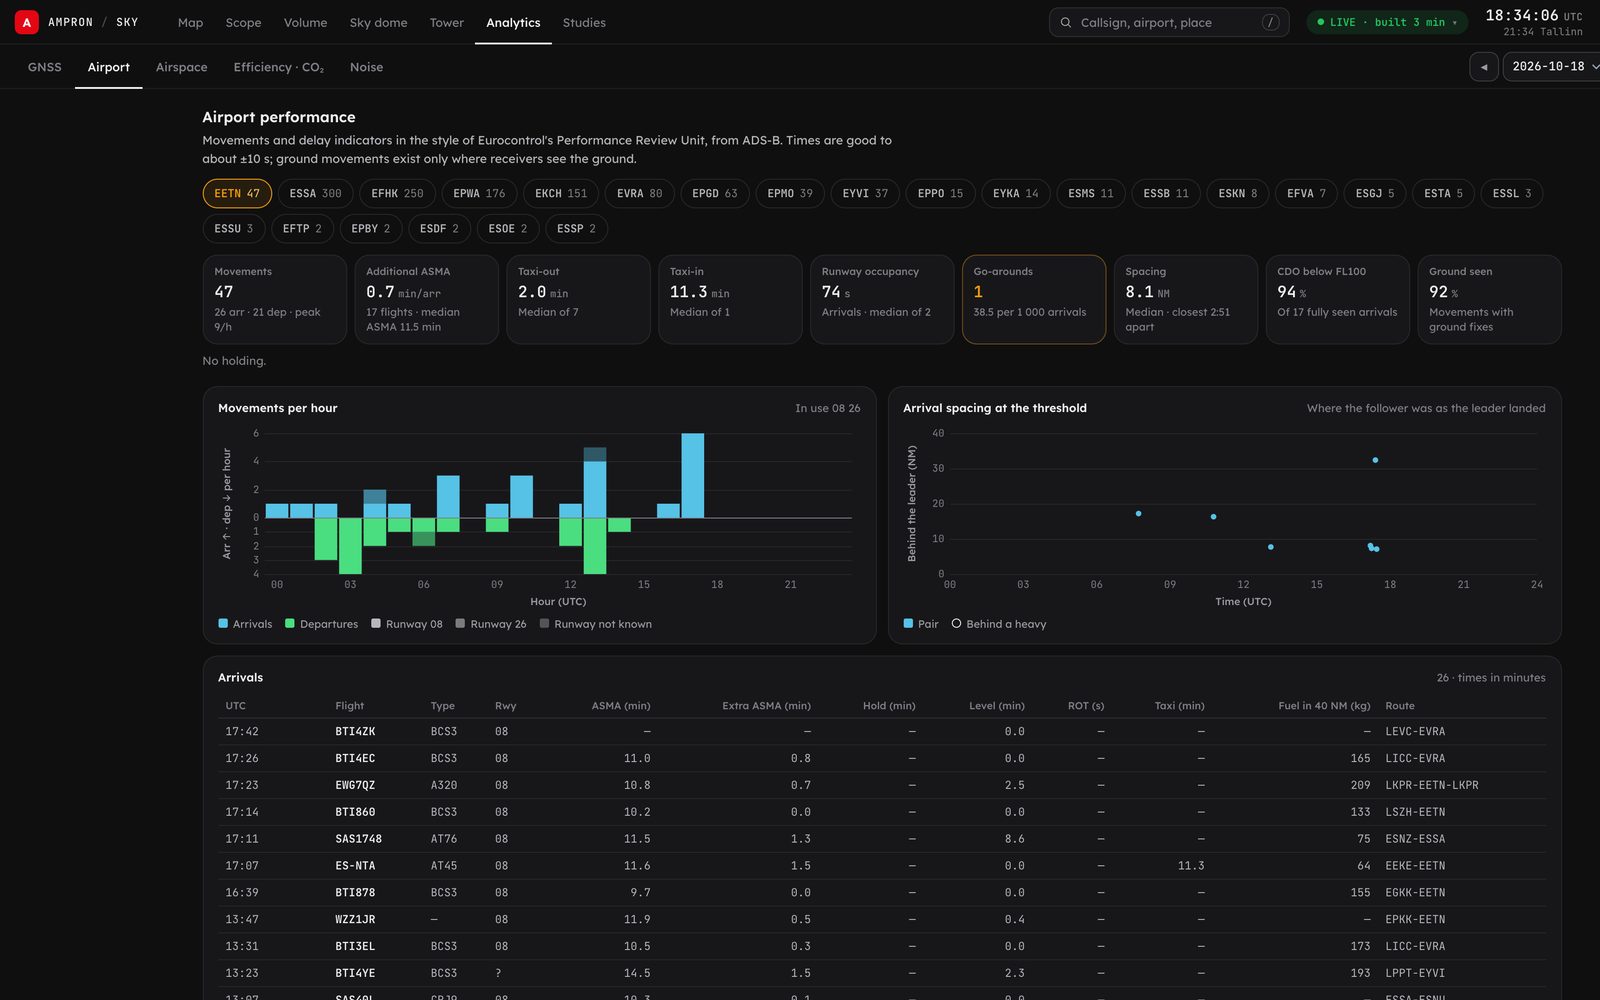
The Analytics view measures what airport operators work with, in the style of Eurocontrol's Performance Review Unit: movements per hour, arrival spacing at the threshold, go-arounds, additional time in the approach area, taxi times, runway occupancy and holding. For the Tallinn FIR it shows entries, occupancy, flows and the use of Estonian areas while they are active, over a day, a week, a month or any dates you choose. Fuel, CO₂ and noise come as screening estimates, labelled as such rather than as inventories or certified contours. Studies lets you draw a volume of airspace anywhere in the recorded Baltic and count what passed through it, with a CSV export.
These figures come from public ADS-B, not from an operator's own systems. They are good enough to ask a sharper question, and they say where they aren't good enough.
Why a display company builds this
Our customers' screens show passenger information, apron status and de-icing instructions: live data from someone else's system. The hard part is never the pixels. It is knowing whether the data behind them can be trusted right now, and saying so on the screen when it can't. Ampron Sky works on that problem in public, every day, over the busiest airspace near us.
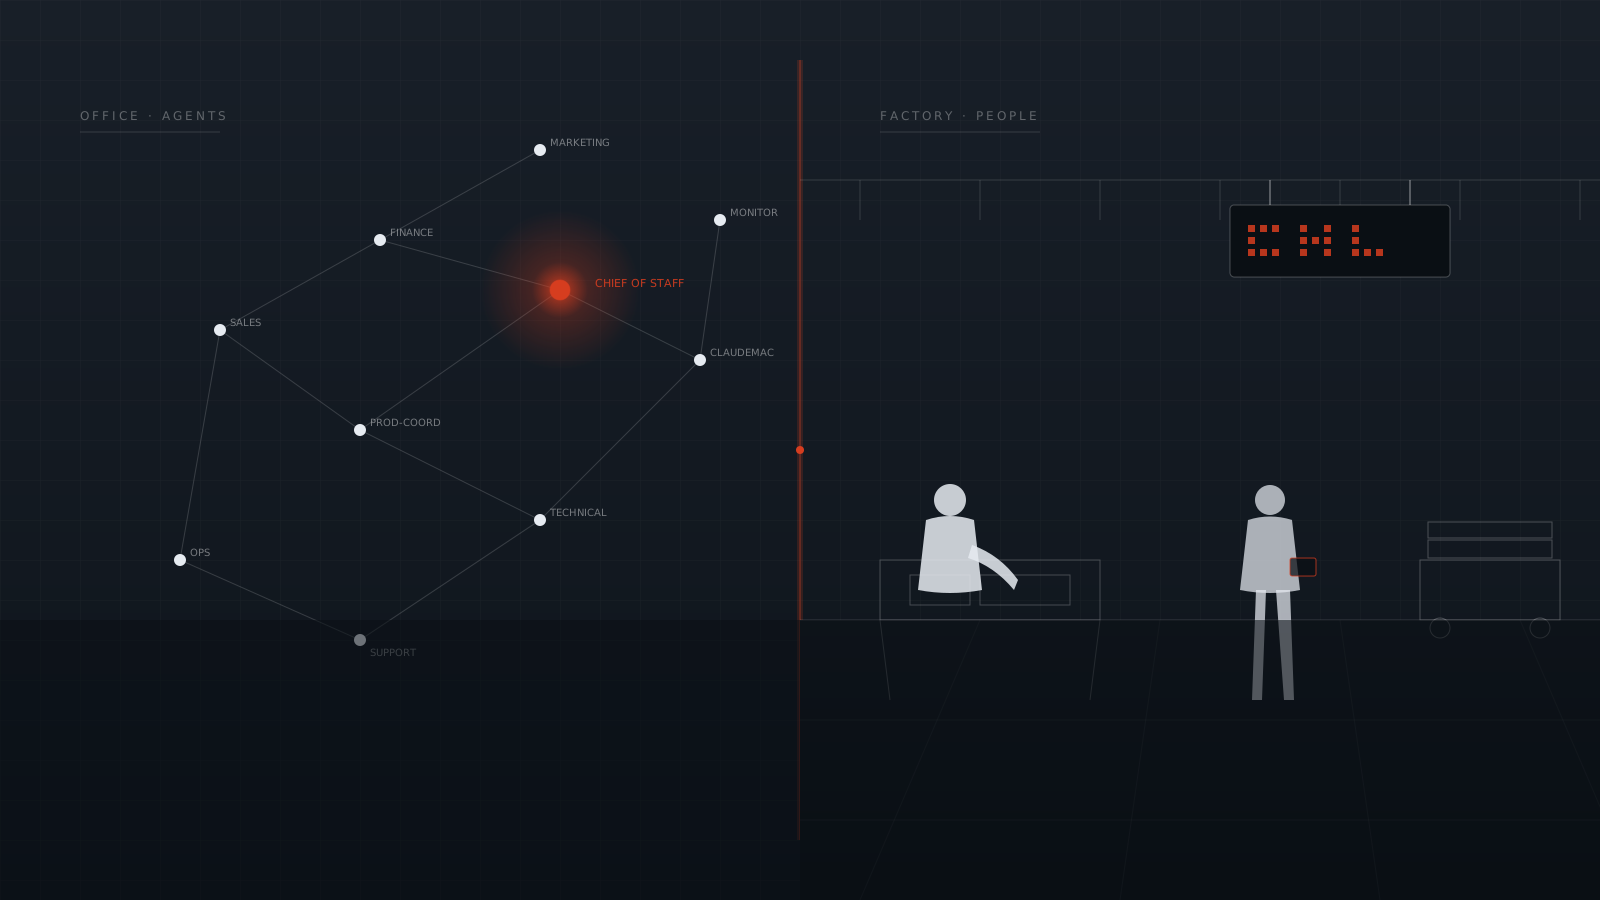
It is also the public side of our aviation work. We have built apron information displays at Tallinn Airport since 2016 and its de-icing pad displays since 2018, and Sky is what we know about aviation data, made visible. It began as a one-day build by Ampron's AI Executive team with Gen Vagula, our CEO, and its GNSS analytics went from a published paper to a live feature in a day as well. Between 17 and 31 October it went through 121 numbered releases, from 1.0.0 to 1.8.0. More on that on the Ampron Sky page.
Ampron Sky is free for personal use. If you run an airport, an air navigation service or a control room and want this kind of picture on a wall display or behind your own systems, tell us about it.
Traffic: adsb.lol contributors (ODbL) and The OpenSky Network. Airspace: openAIP. Map: © OpenStreetMap contributors, OpenFreeMap / OpenMapTiles. Weather: NOAA Aviation Weather Center, MET Norway, SMHI, EUMETNET OPERA, FMI, DMI, Keskkonnaagentuur, ECMWF. NOTAMs: national air navigation service providers and the FAA (full list on Ampron Sky's Sources page). Screenshots are real captures of Ampron Sky. Positions are estimates from public data; not for navigation or operational decisions.